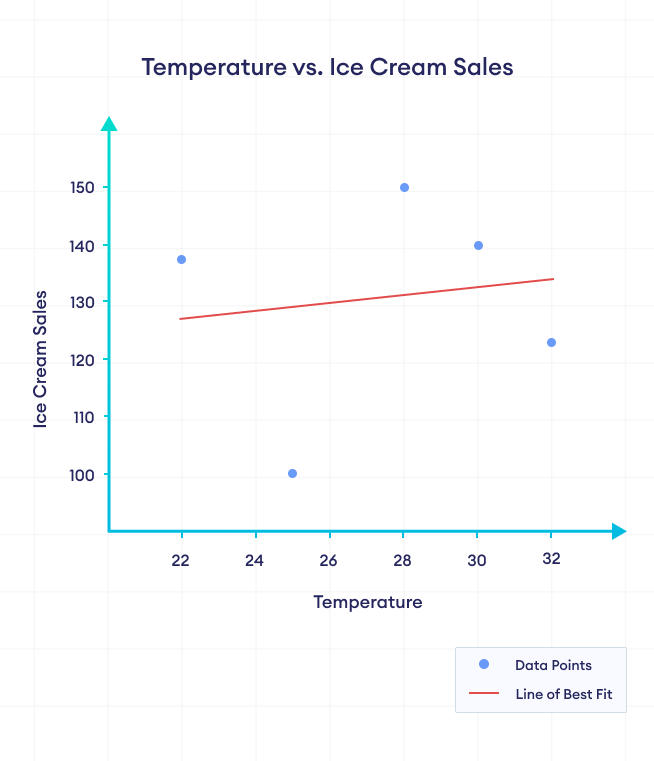
Correlation is a statistical concept that quantifies the degree to which two variables are related to each other.
Correlation can be calculated in Pandas using the corr() function.
Let's look at an example.
import pandas as pd

# create dataframe
data = {
    "Temperature": [22, 25, 32, 28, 30],
    "Ice_Cream_Sales": [105, 120, 135, 130, 125]
}

df = pd.DataFrame(data)

# calculate correlation matrix
print(df.corr())
Output
                 Temperature  Ice_Cream_Sales
Temperature         1.000000         0.923401
Ice_Cream_Sales     0.923401         1.000000
In this example, we used the corr() method on the DataFrame df to calculate the correlation coefficients between the columns.
The output is a correlation matrix that displays the correlation coefficients between all pairs of columns in the dataframe. In this case, there are only two columns, so the matrix is 2x2.
Here, the correlation coefficient between Temperature and Ice_Cream_Sales is 0.923401, which is positive. This indicates that as the temperature increases, the ice cream sales also increase.
The coefficient value of 1.000000 along the diagonal represents the correlation of each column with itself.
Positive and Negative Correlation
Positive correlation refers to a relationship between two variables where they both tend to change in the same direction. When one variable increases, the other variable also tends to increase, and when one variable decreases, the other variable also tends to decrease.
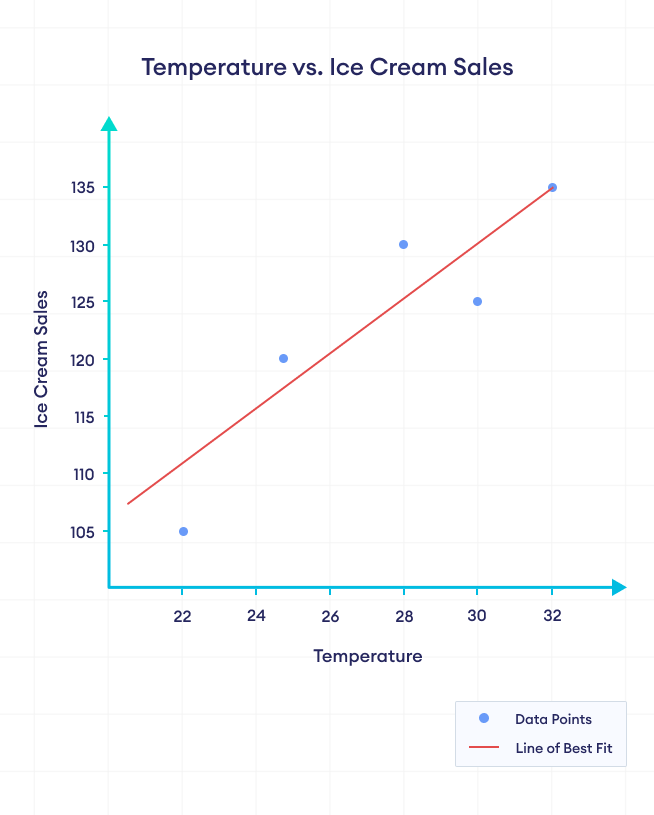
In the figure above, we can clearly see that ice cream sales increase with the increase in temperature. We can say that there is a positive correlation between temperature and ice cream sales.
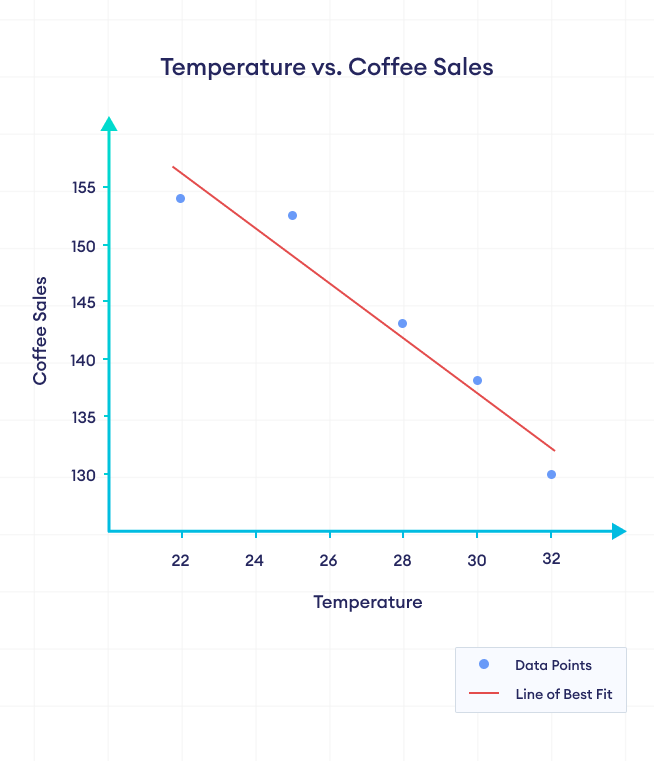
Negative correlation, on the other hand, refers to a relationship between two variables where they tend to change in opposite directions. When one variable increases, the other variable tends to decrease, and vice versa.
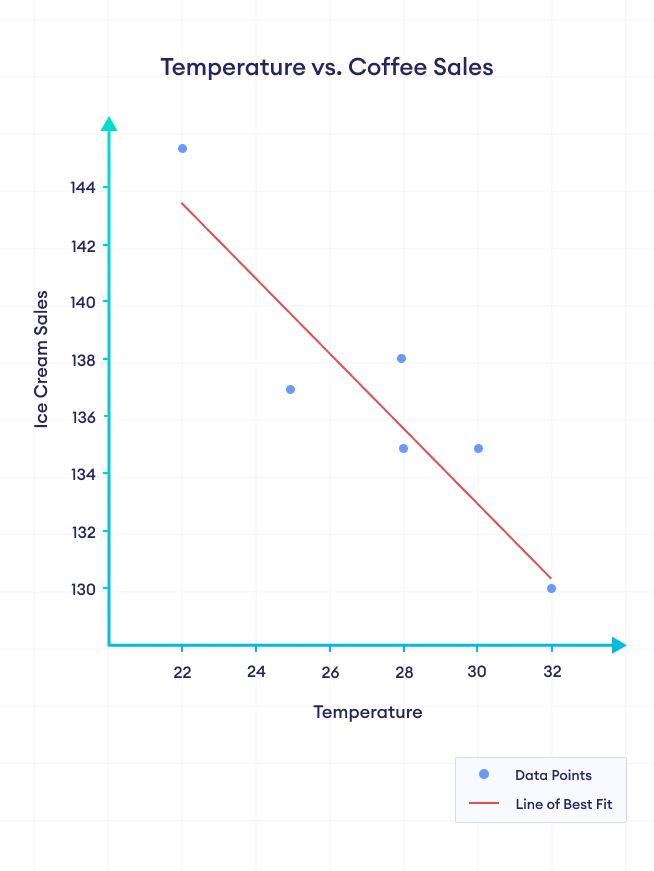
In the figure above, coffee sales decrease with increase in temperature. We can say that there is a negative correlation between temperature and coffee sales.
Example: Correlation Between Two Columns
Instead of finding the whole correlation matrix, we can specify the columns to calculate correlation between them.
import pandas as pd

# create dataframe
data = {
    "Temperature": [22, 25, 32, 28, 30],
    "Ice_Cream_Sales": [105, 120, 135, 130, 125]
}

df = pd.DataFrame(data)

# calculate correlation coefficient
correlation = df['Temperature'].corr(df["Ice_Cream_Sales"])

print(correlation)
Output
0.9234007664064656
In this example, we calculated correlation between Temperature and Ice_Cream_Sales.
The syntax for doing so is:
df['column1'].corr(df['column2'])
Example: Missing Values
DataFrame may contain missing values (NaN). The corr() function completely ignores the rows with NaN values.
import pandas as pd
import numpy as np

# create a dataframe
data = {
    "Temperature": [22, 25, 32, 28, 30],
    "Coffee_Sales": [158, 145, np.nan, np.nan, 140]
}

df = pd.DataFrame(data)

# calculate correlation between Temperature and Ice_Cream_sales
correlation1 = df["Temperature"].corr(df["Coffee_Sales"])

print("With NaN values")
print(df)
print(f"correlation = {correlation1}")
print()

# remove missing values
df.dropna(inplace=True)

# calculate correlation between Temperature and Ice_Cream_sales
correlation2 = df["Temperature"].corr(df["Coffee_Sales"])

print("Without NaN values")
print(df)
print(f"correlation = {correlation2}")
print()
Output
With NaN values
   Temperature  Coffee_Sales
0           22         158.0
1           25         145.0
2           32           NaN
3           28           NaN
4           30         140.0
correlation = -0.923177938058926

Without NaN values
   Temperature  Coffee_Sales
0           22         158.0
1           25         145.0
4           30         140.0
correlation = -0.923177938058926
Notice that the correlation value is the same before and after removing the NaN values. This means that the NaN values are completely ignored by corr().
We used the NumPy Library to generate NaN values.
Correlation Methods in Pandas
We can calculate correlation using three different methods in Pandas:
- Pearson Method (Default): evaluates the linear relationship between two continuous variables
- Kendall Method: measures the ordinal association between two measured quantities
- Spearman Method: evaluates the monotonic relationship between two continuous or ordinal variables
By default, corr() computes the Pearson correlation coefficient, which measures the linear relationship between two variables.
Example: Pearson, Kendall and Spearman Methods
import pandas as pd

# create dataframe
data = {
    "Temperature": [22, 25, 32, 28, 30],
    "Ice_Cream_Sales": [105, 120, 135, 130, 125]
}

df = pd.DataFrame(data)

# calculate different correlation coefficients
pearson = df['Temperature'].corr(df["Ice_Cream_Sales"])
kendall = df['Temperature'].corr(df["Ice_Cream_Sales"], method='kendall')
spearman = df['Temperature'].corr(df["Ice_Cream_Sales"], method='spearman')

# display different correlation coefficient
print(f"Pearson's Coefficient: {pearson}")
print(f"Kendall's Coefficient: {kendall}")
print(f"Spearman's Coefficient: {spearman}")
Output
Pearson's Coefficient: 0.9234007664064656
Kendall's Coefficient: 0.7999999999999999
Spearman's Coefficient: 0.8999999999999998
Here, Pearson's Coefficient has the highest value, which signifies that the correlation is mostly linear.
Perfect, Good & Bad Correlation
We can interpret the correlation values as:
Perfect Correlation
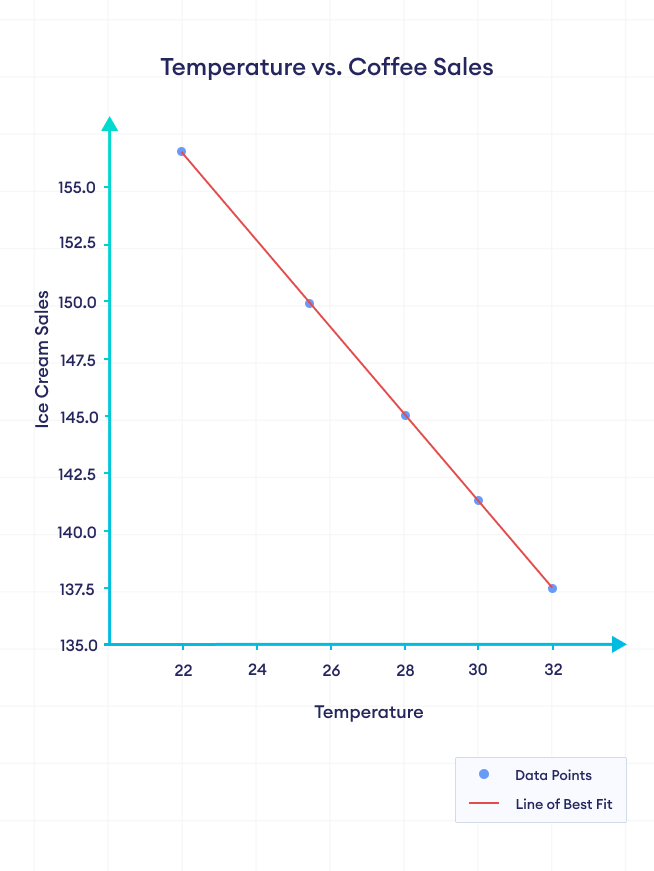
A perfect positive correlation implies that for every increase in one variable, there is a proportionate increase in the other variable, indicated by a coefficient of +1.
A perfect negative correlation, represented by -1, signifies that an increase in one variable leads to a proportionate decrease in the other.
Good Correlation
A good correlation can range from 0.5 to 0.9 (positive or negative) and generally indicates a strong relationship between the variables, but it doesn't mean the relationship is perfect.
Bad Correlation
A bad correlation is typically close to zero, indicating that there is no relationship or any form of dependence between the two variables.
