You can and will encounter errors while writing programs. Errors are not necessarily bad. In fact, most of the time, they help us identify issues with our code. It is essential that you know how to debug your code and fix errors.
Debugging is the process of examining the program, finding the error and fixing it.
There are different ways you can debug your JavaScript program.
1. Using console.log()
You can use the console.log() method to debug the code. You can pass the value you want to check into the console.log() method and verify if the data is correct.
The syntax is:
console.log(object/message);
You could pass the object in console.log() or simply a message string.
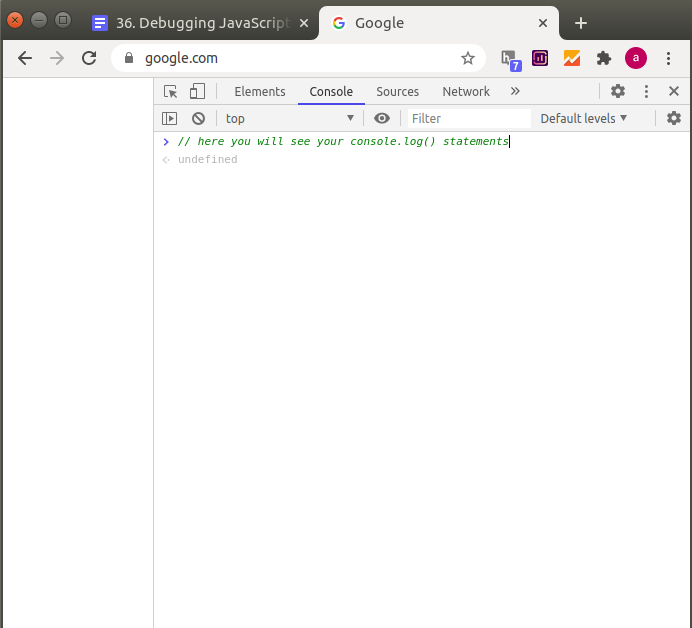
In the previous tutorial, we used console.log() method to print the output. However, you can also use this method for debugging. For example,
let a = 5;
let b = 'asdf';
let c = a + b;

// if you want to see the value of c
console.log(c);

// then do other operations
if(c) {
    // do something
}
Using console.log() method in the browser opens the value in the debugger window.

The console.log() is not specific to browsers. It's also available in other JavaScript engines.
2. Using debugger
The debugger keyword stops the execution of the code and calls the debugging function.
The debugger is available in almost all JavaScript engines.
Let's see an example,
let a = 6;
let b = 9;
let c = a * b;

// stops the execution
debugger;

console.log(c);
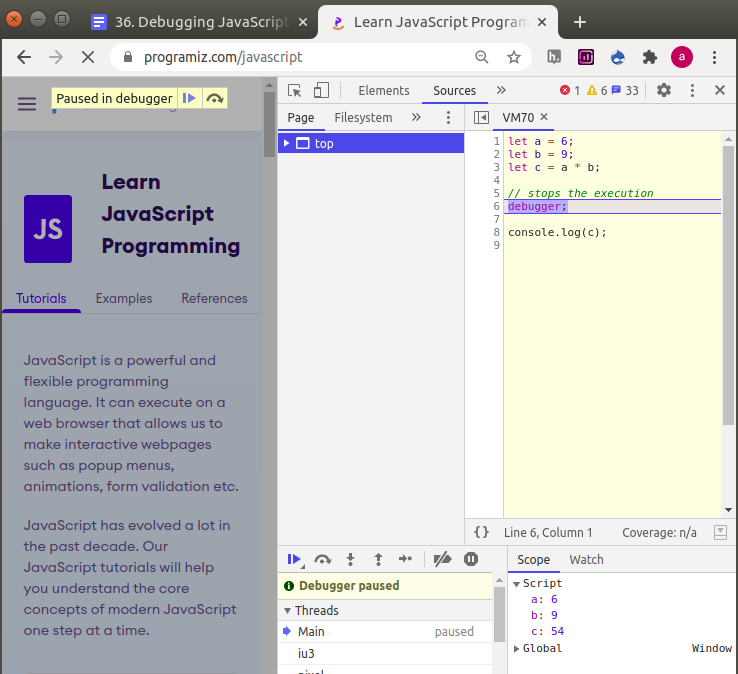
Let's see how you can use debugger in a Chrome browser.

The above program pauses the execution of the program in the line containing the debugger.
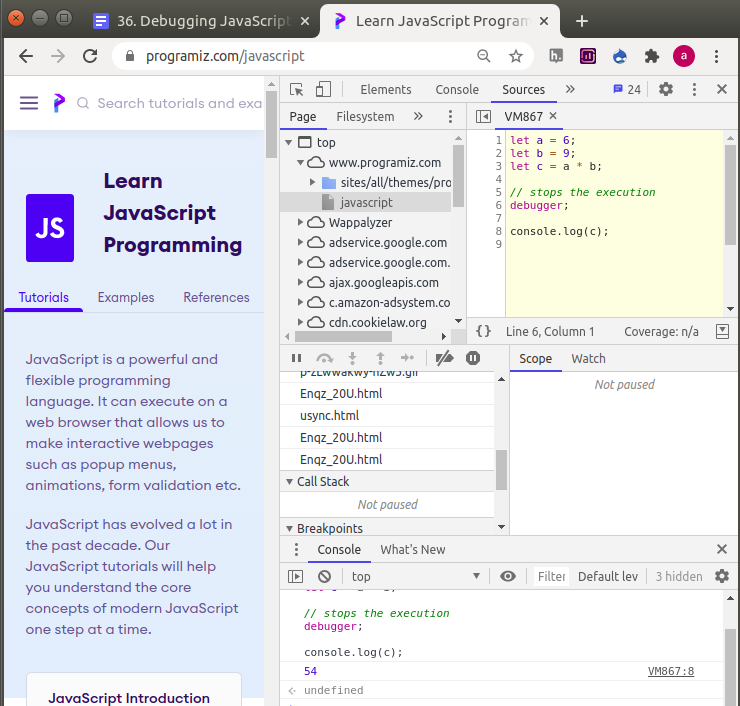
You can then resume the flow control after examining the program.
The rest of the code will execute when you resume the script by pressing play in the console.

3. Setting Breakpoints
You can set breakpoints for JavaScript code in the debugger window.
JavaScript will stop executing at each breakpoint and lets you examine the values. Then, you can resume the execution of code.
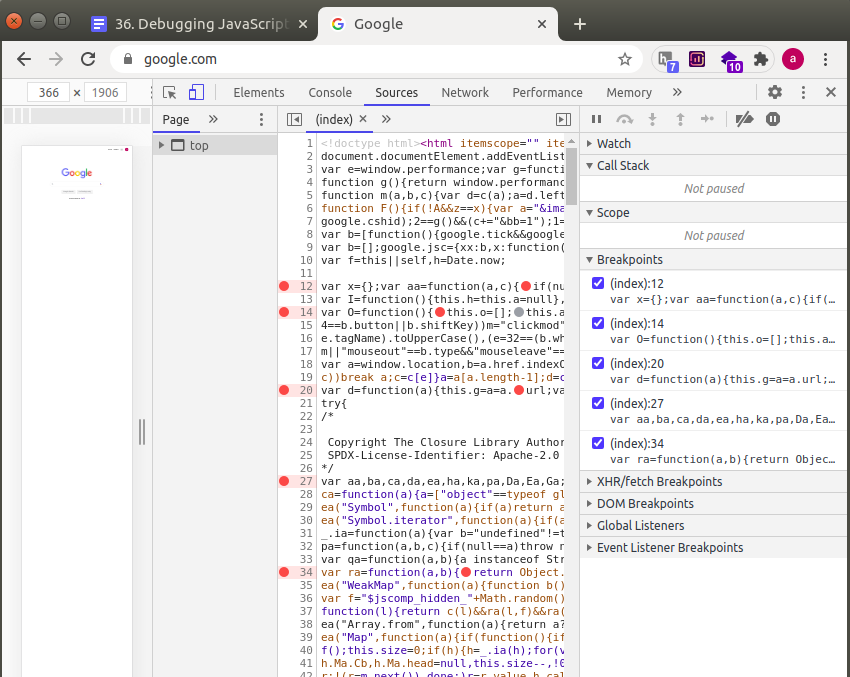
Let's see an example by setting a breakpoint in the Chrome browser.

You can set breakpoints through the Developers tool anywhere in the code.
Setting breakpoints is similar to putting a debugger in the code. Here, you just set breakpoints by clicking on the line number of the source code instead of manually calling the debugger function.
In the above methods, we have used the Chrome browser to show the debugging processes for simplicity. However, it's not your only option.
All good IDEs provide a way for you to debug the code. The debugging process may be a bit different but the concept behind debugging is the same.