The plot() method in Pandas allows us to create various types of plots and visualization.
Example
import pandas as pd
import matplotlib.pyplot as plt

# create a DataFrame
data = {'x': [1, 2, 3, 4, 5], 'y': [10, 14, 18, 24, 30]}
df = pd.DataFrame(data)

# create a line plot
df.plot()

plt.show()
plot() Syntax
The syntax of the plot() method in Pandas is:
df.plot(x=None, y=None, kind='line', figsize=None, title=None, xlabel=None, ylabel=None, legend=True, xlim=None, ylim=None, style=None, color=None)plot() Arguments
The plot() method takes following arguments:
xandy(optional) - specifies the columns from the DataFrame to use as thexandyaxes for the plotkind(optional) - specifies the type of plot to createfigsize(optional) - sets the size of the figuretitle(optional) - sets the title for the plotxlabelandylabel(optional) - sets labels for thexandyaxeslegend(optional) - controls the display of the legendxlimandylim(optional) - sets custom limits for thexandyaxesstyle(optional) - allows us to specify a style for the plotcolor(optional) - sets the color for the plot elements
plot() Return Value
The plot() method in Pandas returns a plot of our data.
Example1: Plot a Line
import pandas as pd
import matplotlib.pyplot as plt

# create a DataFrame
data = {'Months': ['Jan', 'Feb', 'Mar', 'Apr', 'May'],
        'Temperature (°C)': [5, 8, 15, 20, 25]}
df = pd.DataFrame(data)

# create a line plot with xlabel, ylabel, and title
result = df.plot(x='Months', y='Temperature (°C)', kind='line', xlabel='Months', ylabel='Temperature (°C)', title='Monthly Temperature Variation')

plt.show()
Output
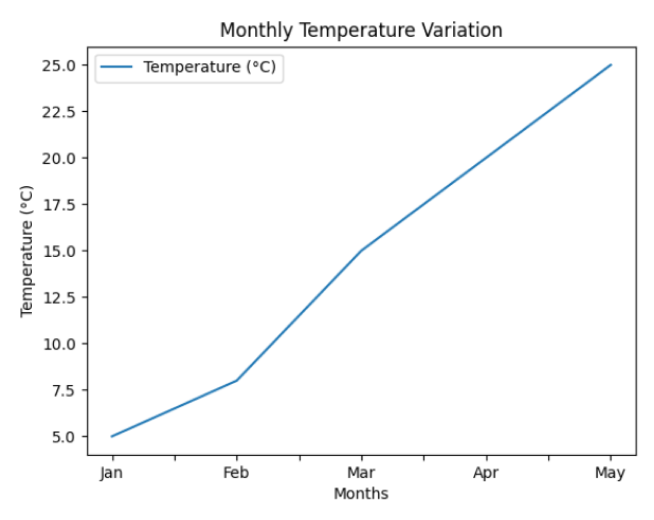
In the above example, we have used the plot() method to create a line plot of temperature.
We have passed multiple arguments inside plot(),
x='Months': specifies'Months'column to be used for the x-axis values in the ploty='Temperature (°C)': specifies'Temperature (°C)'column to be used for the y-axis values in the plotkind='line': specifies to create a line plotxlabel='Months': sets the label for the x-axis toMonthsylabel='Temperature (°C)': sets the label for the y-axis toTemperature (°C)title='Monthly Temperature Variation': sets the title of the plot toMonthly Temperature Variation
If we don't pass any argument inside plot() as:
# create a line plot without passing any arguments
result = df.plot()
The output would be:
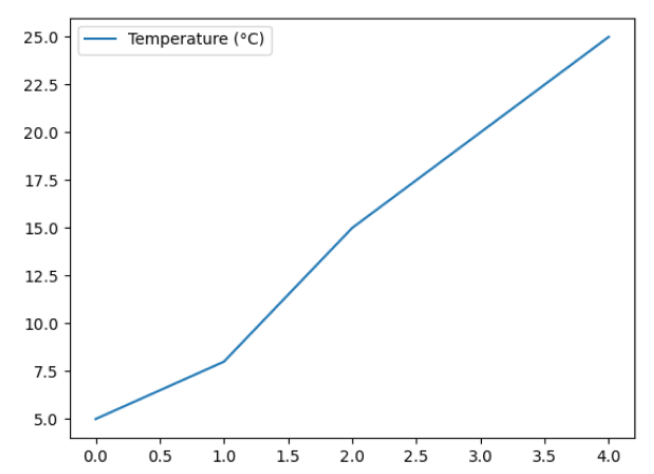
It's better to use meaningful arguments to enhance the clarity and purpose of our plot.
Example2: Create a Bar Plot With Custom Figure Size
import pandas as pd
import matplotlib.pyplot as plt

# create a DataFrame
data = {'Cities': ['New York', 'Los Angeles', 'Chicago', 'Houston', 'Phoenix'],
        'Population (millions)': [8.4, 3.9, 2.7, 2.3, 1.8]}
df = pd.DataFrame(data)

# create a bar plot
# also set a custom size for the figure using the figsize parameter
ax = df.plot(x='Cities',
             y='Population (millions)',
             kind='bar',
             figsize=(8, 10),
             xlabel='Cities',
             ylabel='Population (millions)',
             title='Population of Major U.S. Cities')

# show the plot
plt.show()
Output
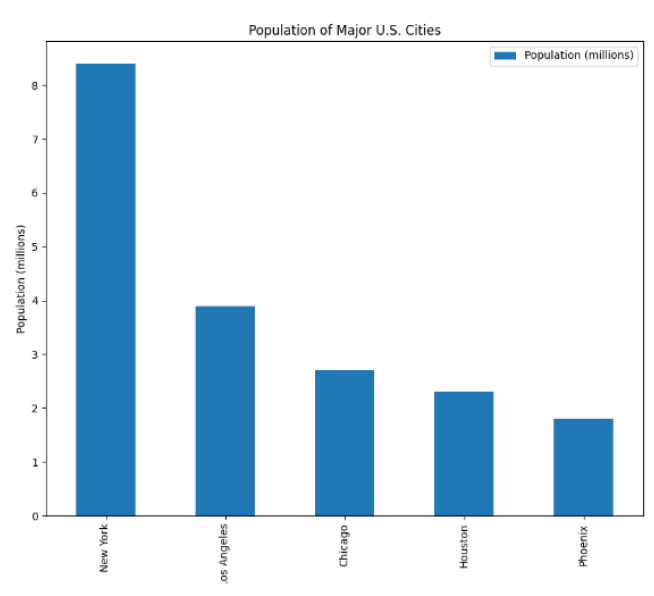
Here, we have used kind='bar' inside the plot() method to create a bar plot of the given data.
We have also used the figsize=(8,10) parameter inside plot() to set the custom size of the figure to be 8 inches in width and 10 inches in height.
Example 3: Create a Histogram
import pandas as pd
import matplotlib.pyplot as plt

# create a DataFrame
data = {'Age': [25, 30, 35, 40, 45, 50, 55, 60, 65, 70, 75]}
df = pd.DataFrame(data)

# create a histogram
ax = df.plot(y='Age',
          kind='hist',
          bins=5,
          rwidth=0.9,
          legend=True,
          ylabel='Frequency',
          title='Age Distribution')

# show the plot
plt.show()
Output

Here, we use the plot() method to create a histogram by specifying:
y='Age'- the column to be plotted on the y-axiskind='hist'- the type of plot to be a histogrambins=5- the number of bins or intervals in the histogram to be 5rwidth=0.9- the width of the bars in the histogramlegend=False- displaying the legend is set toFalseylabel='Frequency'- setting the label for the y-axistitle='Age Distribution'- setting the title of the plot
Note: The bins and rwidth parameters are specific to the 'hist' kind of plot when using plot() for creating histograms. They are not applicable to other types of plots. To learn more, visit Pandas Histogram.
Example 4: Create a Scatter Plot
import pandas as pd
import matplotlib.pyplot as plt

# create a DataFrame
data = {'X': [1, 2, 3, 4, 5, 6, 7, 8, 9, 10],
        'Y': [10, 12, 8, 14, 18, 24, 22, 30, 28, 35]}
df = pd.DataFrame(data)

# create a scatter plot
result = df.plot(x='X',
                     y='Y',
                     kind='scatter',
                     xlabel='X-axis',
                     ylabel='Y-axis',
                     title='Scatter Plot',
                     marker='o',
                     color='blue')

# show the plot
plt.show()
Output

In the above example, we have used kind='scatter' inside plot() to create a scatter plot.
Here,
- The
marker='o'parameter specifies that circular markers (dots) should be used in the scatter plot. - The
color='blue'parameter sets the color of the markers to blue.
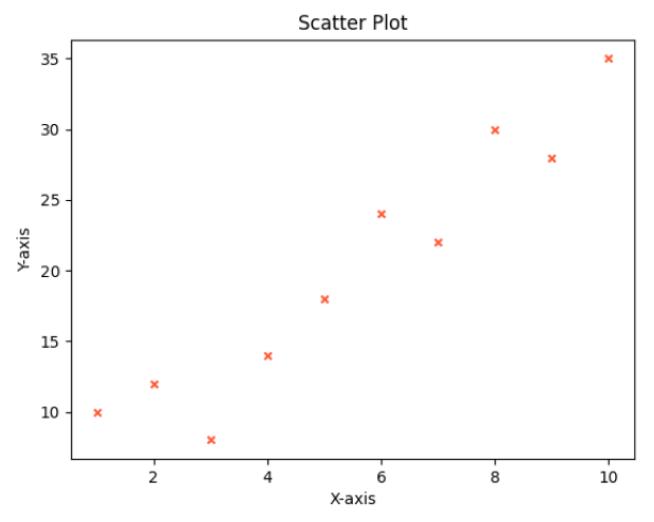
We can use different marker styles like 's', '*', 'x', etc. and also specify colors using hexadecimal codes like #FF5733. For example,
# create a scatter plot with a custom marker 'x' and hex color '#FF5733'
result = df.plot(x='X', y='Y', kind='scatter', xlabel='X-axis', ylabel='Y-axis', title='Scatter Plot', marker='x', color='#FF5733')
The output would be:
Example 5: Create a Pie Chart
import pandas as pd
import matplotlib.pyplot as plt

# create a DataFrame
data = {'Categories': ['Category A', 'Category B', 'Category C', 'Category D'],
        'Values': [30, 45, 15, 20]}
df = pd.DataFrame(data)

# create a pie chart
ax = df.plot(y='Values',
             kind='pie',
             labels=df['Categories'],
             autopct='%1.1f%%',
             legend=False,
             title='Pie Chart Example')

# show the plot
plt.axis('equal')
plt.show()
Output
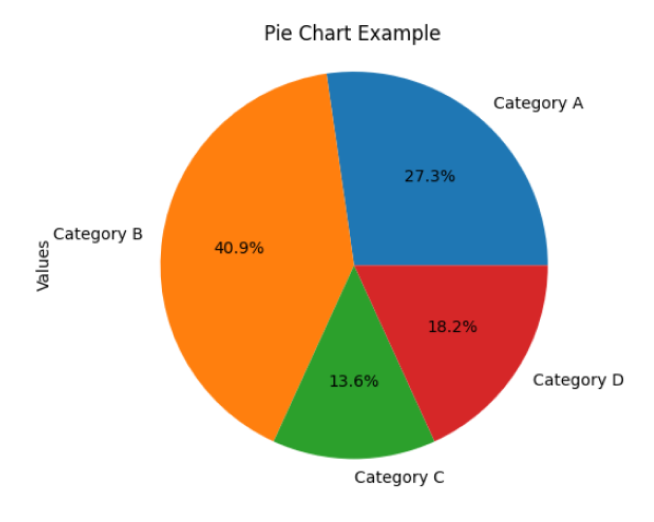
In the above example, we used the plot() method with kind='pie' to create a pie chart. We specified the Values column as the data to be plotted and set the labels using labels=df['Categories'].
Here, the autopct='%1.1f%%' parameter formats the percentages displayed on each wedge of the pie chart. And the plt.axis('equal') ensures that the pie chart is drawn as a circle.